Trading Patterns Cheat Sheet: A Comprehensive Guide for Traders


Trading Patterns Cheat Sheet: A Comprehensive Guide for Traders
Introduction
In the fast-paced world of trading, having a solid understanding of various trading patterns is essential for success. Traders rely on these patterns to identify potential opportunities, make informed decisions, and maximize their profits. In this article, we will provide you with a comprehensive trading patterns cheat sheet, outlining key patterns that every trader should know. Whether you are a beginner or an experienced trader, this guide will equip you with valuable insights to enhance your trading strategies.
Table of Contents
- Introduction
- Understanding Trading Patterns
- 2.1 What Are Trading Patterns?
- 2.2 Why Are Trading Patterns Important?
- Common Trading Patterns
- 3.1 Head and Shoulders Pattern
- 3.2 Double Top and Double Bottom Patterns
- 3.3 Triangles
- 3.4 Flags and Pennants
- 3.5 Wedges
- 3.6 Cup and Handle Pattern
- 3.7 Moving Average Crossovers
- 3.8 Bollinger Bands
- 3.9 Fibonacci Retracement
- 3.10 Support and Resistance Levels
- Implementing Trading Patterns
- 4.1 Technical Analysis Tools
- 4.2 Backtesting and Demo Trading
- 4.3 Risk Management
- Advanced Trading Patterns
- 5.1 Harmonic Patterns
- 5.2 Gaps
- 5.3 Candlestick Patterns
- 5.4 Elliott Wave Theory
- 5.5 Volume Analysis
- 5.6 Market Divergences
- Conclusion
- FAQs
Understanding the Trading Patterns Cheat Sheet
2.1 What Are Trading Patterns?
Trading patterns are recurring formations or shapes that appear on price charts. These patterns reflect the collective behavior of market participants and can provide insights into future price movements. Traders analyze these patterns to anticipate market trends and make informed trading decisions.
2.2 Why Are Trading Patterns Important?
Trading patterns offer valuable information about market sentiment and potential price reversals. By identifying these patterns, traders can gain a competitive edge and improve their chances of success. Patterns help traders determine entry and exit points, set stop-loss orders, and assess the risk-reward ratio of a trade.
Common Trading Patterns
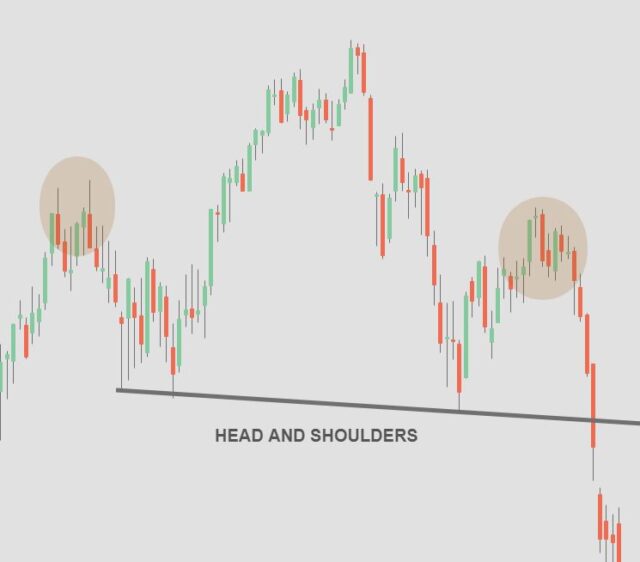
3.1 Head and Shoulders Pattern
The head and shoulders pattern is a reliable reversal pattern that indicates a potential trend reversal. It consists of three peaks, with the middle peak (the head) being higher than the other two (the shoulders). Traders look for a break below the neckline to confirm the pattern and initiate a short position.
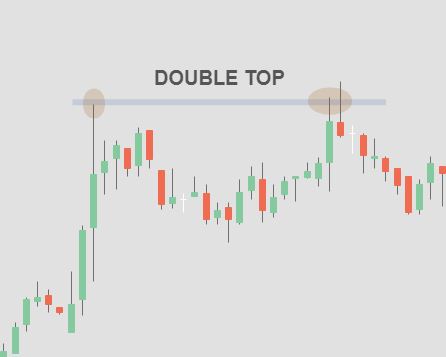
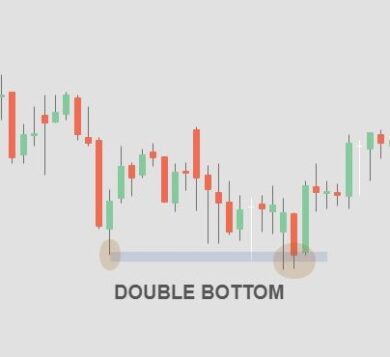
3.2 Double Top and Double Bottom Patterns
The double top pattern forms when the price reaches a resistance level twice and fails to break above it. This signals a potential bearish reversal. Conversely, the double bottom pattern occurs when the price finds support at a certain level twice, indicating a bullish reversal.
3.3 Triangles
Triangles are consolidation patterns that represent a period of indecision in the market. They can be symmetrical, ascending, or descending. Traders watch for a breakout from the triangle formation, which often leads to a significant price move.
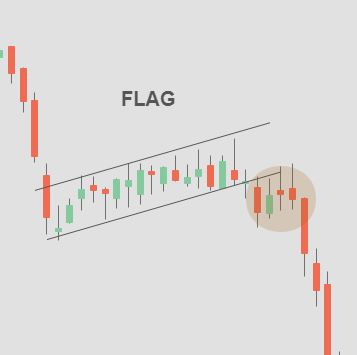
3.4 Flags and Pennants
Flags and pennants are short-term continuation patterns that occur after a sharp price movement. They resemble a rectangular flagpole with a flag or a pennant shape. Traders look for a breakout from these patterns to confirm the continuation of the previous trend.
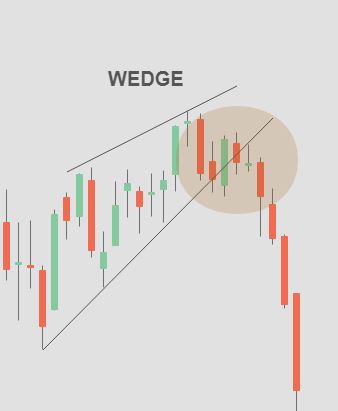
3.5 Wedges
Wedges are similar to triangles but have a more pronounced slant. They can be either rising (bullish) or falling (bearish). Traders analyze the breakout direction to determine potential trading opportunities.
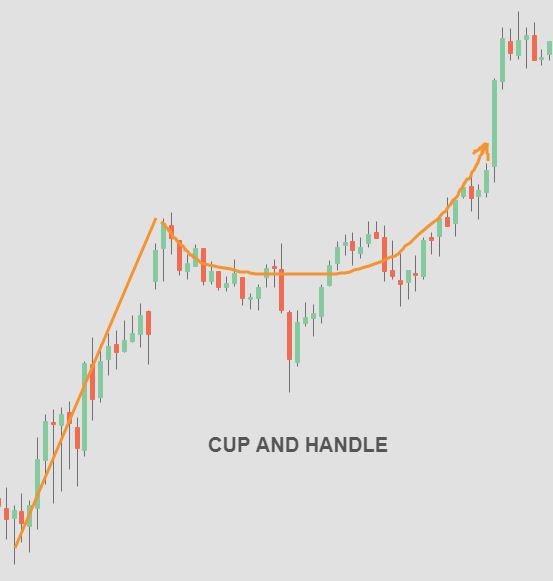
3.6 Cup and Handle Pattern
The cup and handle pattern is a bullish continuation pattern that resembles a cup with a handle. Traders look for a breakout from the handle formation as a signal to enter a long position.
3.7 Moving Average Crossovers
Moving average crossovers occur when two moving averages of different periods intersect. Traders use these crossovers to identify potential trend reversals and generate buy or sell signals.
3.8 Bollinger Bands
Bollinger Bands consist of a middle band (usually a moving average) and two outer bands that represent the standard deviation of prices. Traders analyze the width of the bands to gauge volatility and identify potential buy or sell signals.
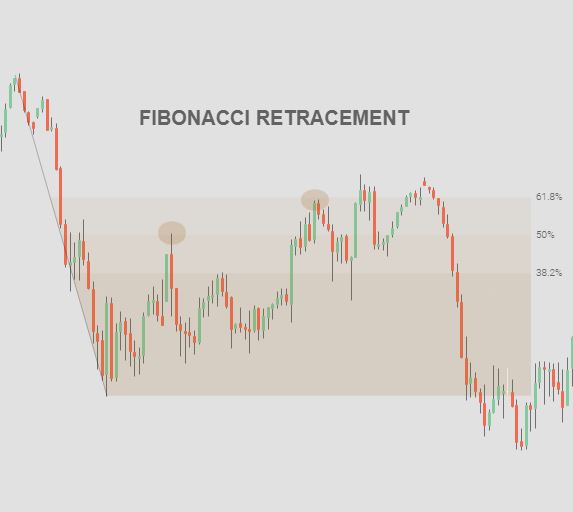
3.9 Fibonacci Retracement
Fibonacci retracement is a technical analysis tool that helps traders identify potential support and resistance levels based on the Fibonacci sequence. Traders use these levels to anticipate price reversals or continuation of trends.
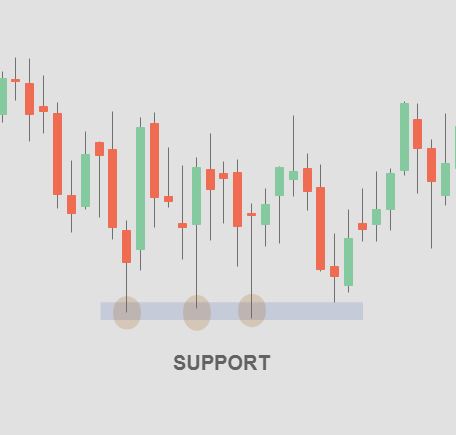
3.10 Support and Resistance Levels
Support and resistance levels are price levels where the buying or selling pressure is strong enough to halt or reverse a price movement. Traders use these levels to determine entry and exit points and set stop-loss orders.
Implementing Trading Patterns
4.1 Technical Analysis Tools
Traders can utilize various technical analysis tools, such as charting software, indicators, and oscillators, to identify and confirm trading patterns. These tools provide additional insights and help traders make more informed decisions.
4.2 Backtesting and Demo Trading
Before implementing trading patterns in live trading, it is advisable to backtest the patterns on historical data or practice them in a demo trading environment. This allows traders to assess the effectiveness of the patterns and fine-tune their strategies.
4.3 Risk Management
Effective risk management is crucial when trading patterns. Traders should set appropriate stop-loss orders, manage position sizes, and diversify their portfolios to minimize potential losses and protect their capital.
Advanced Trading Patterns
5.1 Harmonic Patterns
Harmonic patterns are complex chart patterns that incorporate Fibonacci levels and geometry to identify potential reversal zones. Traders use harmonic patterns, such as Gartley, Butterfly, and Bat patterns, to anticipate price movements with high accuracy.
5.2 Gaps
Gaps occur when the price opens significantly higher or lower than the previous day’s close. Traders analyze these gaps to assess market sentiment and potential future price movements.
5.3 Candlestick Patterns
Candlestick patterns provide valuable insights into market psychology and can indicate potential reversals or continuations. Traders study patterns like doji, hammer, engulfing, and shooting star to identify trading opportunities.
5.4 Elliott Wave Theory
The Elliott Wave Theory is a complex analysis technique that identifies repetitive wave patterns in financial markets. Traders use this theory to predict future price movements based on wave counts and market cycles.
5.5 Volume Analysis
Volume analysis helps traders assess the strength of price movements. By analyzing trading volume alongside price patterns, traders can confirm the validity of trading signals and anticipate market trends.
5.6 Market Divergences
Market divergences occur when the price moves in the opposite direction of an indicator, such as the Relative Strength Index (RSI) or Moving Average Convergence Divergence (MACD). Traders use these divergences to identify potential trend reversals.
Conclusion – Trading Patterns Cheat Sheet
Trading patterns play a significant role in the decision-making process of traders. By understanding and utilizing these patterns effectively, traders can enhance their trading strategies and improve their overall performance. Remember to conduct thorough analysis, practice risk management, and continually educate yourself to stay ahead in the dynamic world of trading.
FAQs
Q1: How can I identify trading patterns in real-time? To identify trading patterns in real-time, traders can use charting software that provides real-time data and technical analysis tools. These tools help spot patterns as they form, allowing traders to make timely decisions.
Q2: Are trading patterns suitable for all financial markets? Yes, trading patterns can be applied to various financial markets, including stocks, forex, commodities, and cryptocurrencies. However, it is essential to consider market-specific factors and adapt your strategies accordingly.
Q3: Can I solely rely on trading patterns for successful trading? While trading patterns are valuable tools, successful trading requires a holistic approach. Traders should combine pattern analysis with other technical indicators, fundamental analysis, and market research for comprehensive decision-making.
Q4: How often do trading patterns occur? Trading patterns occur regularly in the market, but their frequency may vary depending on the timeframe and market conditions. Traders should observe multiple timeframes to identify patterns with higher accuracy.
Q5: Where can I learn more about advanced trading patterns? To delve deeper into advanced trading patterns, traders can refer to specialized books, attend webinars or workshops, and participate in online trading communities. Continuous learning and practice are key to mastering advanced patterns.